Ceph Monitoring
The Ceph page provides dedicated monitoring for Proxmox nodes running a Ceph storage cluster. Get a consolidated view of cluster health, OSD status, pool configuration, and performance metrics without leaving ProxCenter.
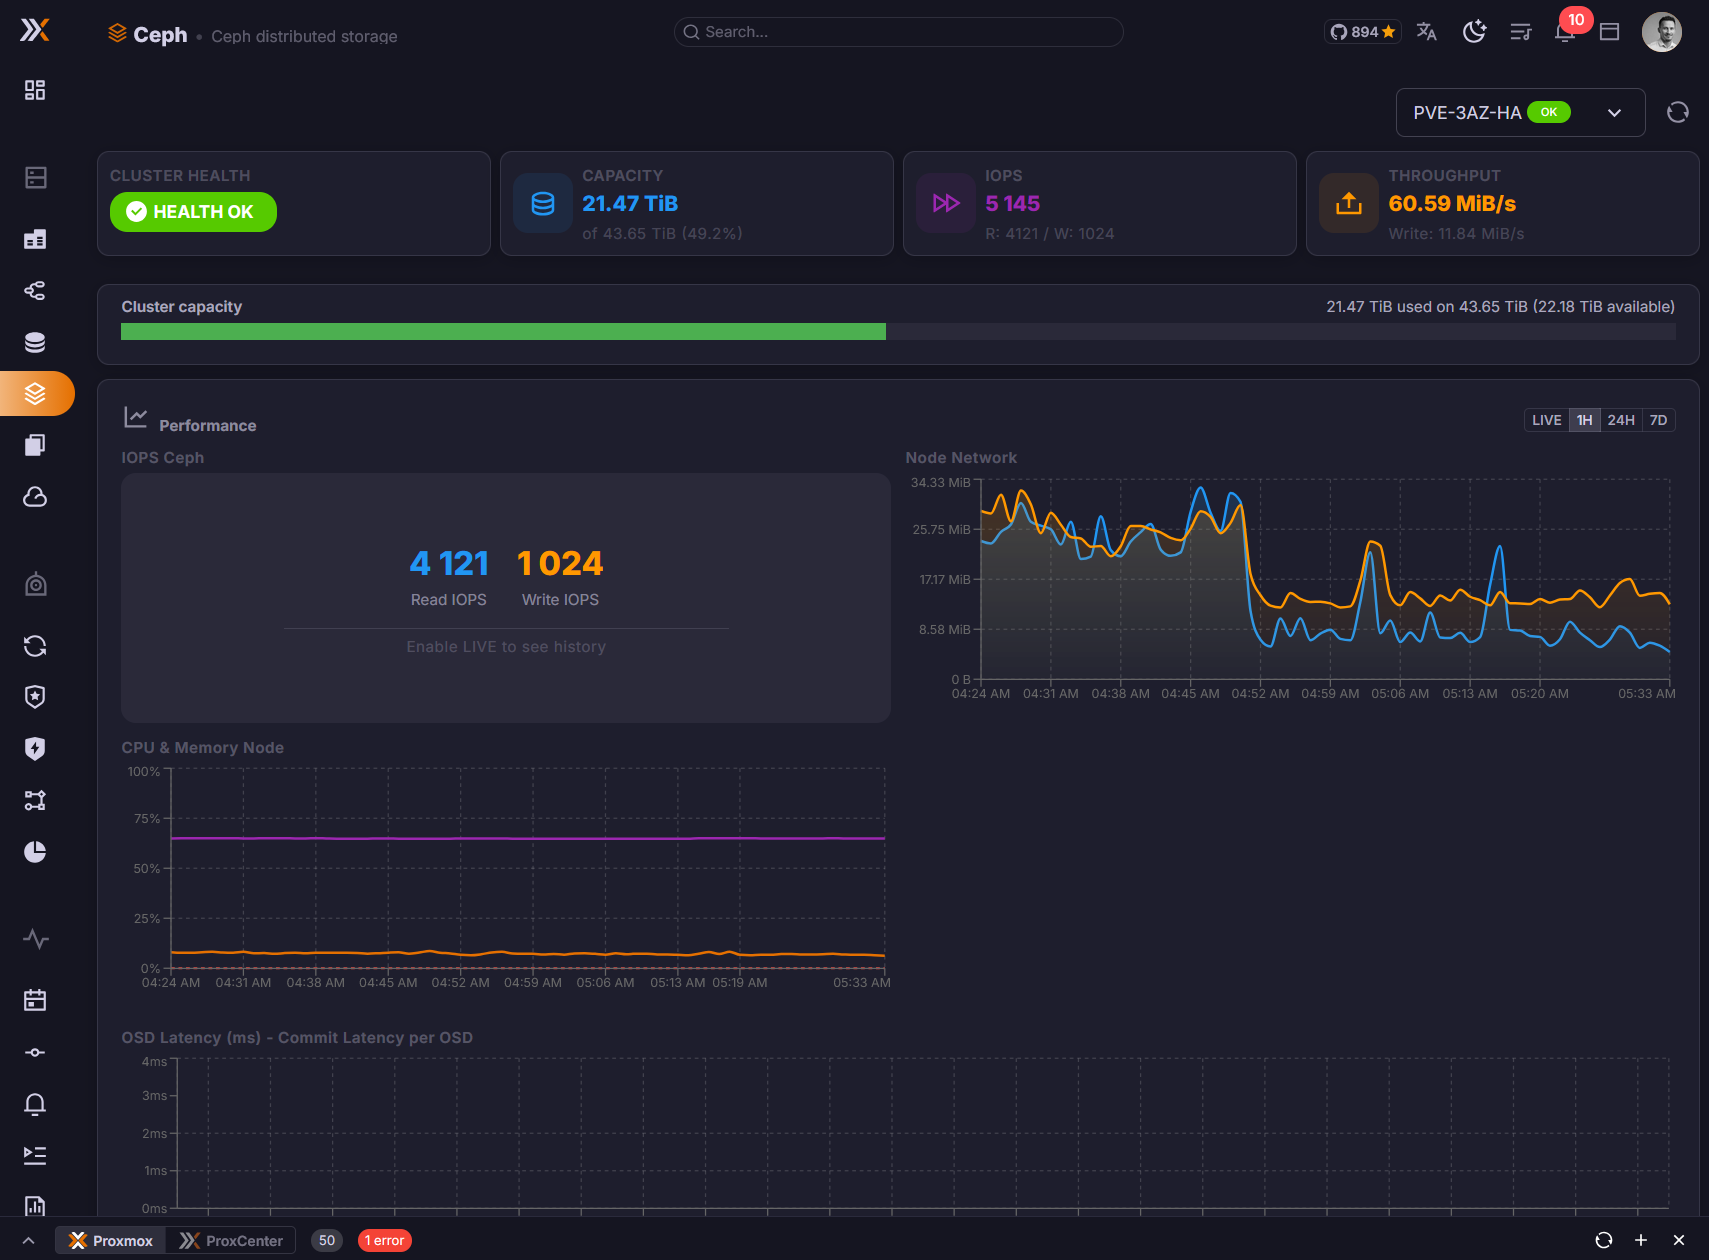
This page is only relevant if one or more of your connected Proxmox nodes are part of a Ceph cluster. If no Ceph configuration is detected, the page will indicate that no Ceph cluster is available.
Cluster Health Overview
The top of the page displays the overall health status of your Ceph cluster:
- Health status --
HEALTH_OK,HEALTH_WARN, orHEALTH_ERRwith a color-coded indicator - Health messages -- Any active warnings or error messages reported by the Ceph monitor
- Monitor quorum -- List of Ceph monitors and their quorum status
- Cluster capacity -- Total raw storage, used space, and available space across all OSDs
- OSD Flags -- the cluster-wide flags currently set, and a pencil that opens the eight switches to change them, see OSD Flags
A HEALTH_WARN status does not always indicate a critical problem. Common warnings include near-full OSDs, degraded placement groups recovering after a node restart, or clock skew between monitors. Review the health messages for details.
What a HEALTH_ERR Names
A cluster in error used to report the status string and nothing else, in the connection diagnostics as in the Site Recovery preflight, so an operator was told the cluster was in HEALTH_ERR and left to go and find out why on a node. It now lists every condition behind the status, as CODE: message, sorted by code and separated by semicolons, the way the warning case already did:
AUTH_INSECURE_SERVICE_TICKETS: Monitors are configured to issue insecure service tickets; OSD_FULL: 1 full osd(s)
The code is what matters: it is what ceph health detail is searched by, and what a release note or a mailing list thread names. Reading the detail from the first entry of a map, as it did before, handed out one of the conditions at random and a different one on each reopen.
The same reading matters for Site Recovery, whose preflight refused to create a replication job against any cluster that was not HEALTH_OK or HEALTH_WARN. Ceph 20.2.4 added insecure-authentication checks at error severity, so a cluster still holding old keys reports HEALTH_ERR while serving I/O perfectly. The preflight now blocks only on the conditions that really refuse writes, full OSDs or pool, inactive placement groups, and the pause and full flags, and warns on everything else.
OSD Status
The OSD (Object Storage Daemon) section lists all OSDs across your Ceph cluster with their current state:
| Field | Description |
|---|---|
| OSD ID | Unique identifier of the OSD |
| Node | The Proxmox host where the OSD is running |
| Status | up / down -- whether the OSD daemon is running |
| State | in / out -- whether the OSD is participating in data placement |
| Used | Space consumed on this OSD |
| Total | Total capacity of the OSD |
| Usage % | Percentage of capacity used |
| Class | Device class (HDD, SSD, NVMe) |
OSDs that are down or out are highlighted so you can quickly identify storage devices that need attention.
Clicking a row opens the OSD's detail dialog, with its version, its reweight, its placement groups and its latencies.
Ceph reports no latency for an OSD that is down, which arrives as a zero. Rendered as such it would read as a perfect disk, which is the opposite of the truth, so the dialog shows a dash instead.
OSD Flags
The OSD Flags block at the top of the page lists the cluster-wide flags currently set: "Cluster-wide OSD flags affect all OSDs. Use these to prevent data rebalancing during maintenance." When none is set it says so.
The pencil opens the eight switches, so a flag such as noout can be set before pulling a node and cleared afterwards without leaving ProxCenter. Reading the flags needs the node view permission and changing them needs the node management permission; on a connection where you hold only the former the block hides itself, rather than offering eight switches that would be refused.
Pool Information
The Pools section shows all Ceph pools configured in your cluster:
- Pool name -- The identifier of the pool
- Size / Min Size -- Replication factor and minimum number of replicas required for I/O
- Placement Groups (PGs) -- Number of placement groups assigned to the pool
- Usage -- Data stored, total capacity allocated, and usage percentage
- CRUSH Rule -- The CRUSH rule governing data placement for the pool
- Application -- Which Ceph application the pool serves (RBD, CephFS, RGW)
A pool row opens its own detail dialog with its target placement groups, its autoscale mode and its CRUSH rule, and a monitor row opens its rank and its store size. A pool reports its used ratio as a fraction where an OSD reports a percentage, and the page normalises the two rather than showing one of them a hundred times too small.
Performance Metrics
The performance section provides real-time insight into Ceph cluster throughput and responsiveness:
- IOPS -- Read and write operations per second across the cluster
- Throughput -- Read and write bandwidth (MB/s)
- Latency -- Average commit and apply latency for OSD operations
- Recovery -- If the cluster is recovering or rebalancing, the rate and estimated time remaining
These metrics help you identify performance bottlenecks and verify that your Ceph cluster is operating within expected parameters.
The page used to mix two clocks. The historical series arrived with its labels already formatted inside the API route, which runs on the container's clock, while the live series formatted theirs in the browser, so the two halves of one page could disagree by the offset between them. The route returns raw timestamps now and every axis is built locally, in the application's locale: seconds on the rolling live windows, where the points are a few seconds apart, and a date once a historical window passes a day. Snapshot times had the same defect and are formatted the same way, on the guest detail tabs and in the clone dialog.
Permissions
Access to the Ceph Monitoring page requires the following RBAC permission:
| Permission | Description |
|---|---|
storage.view | View Ceph cluster status, OSD information, pools, and performance metrics |
Users without this permission will not see the Ceph entry in the sidebar.