Inventory
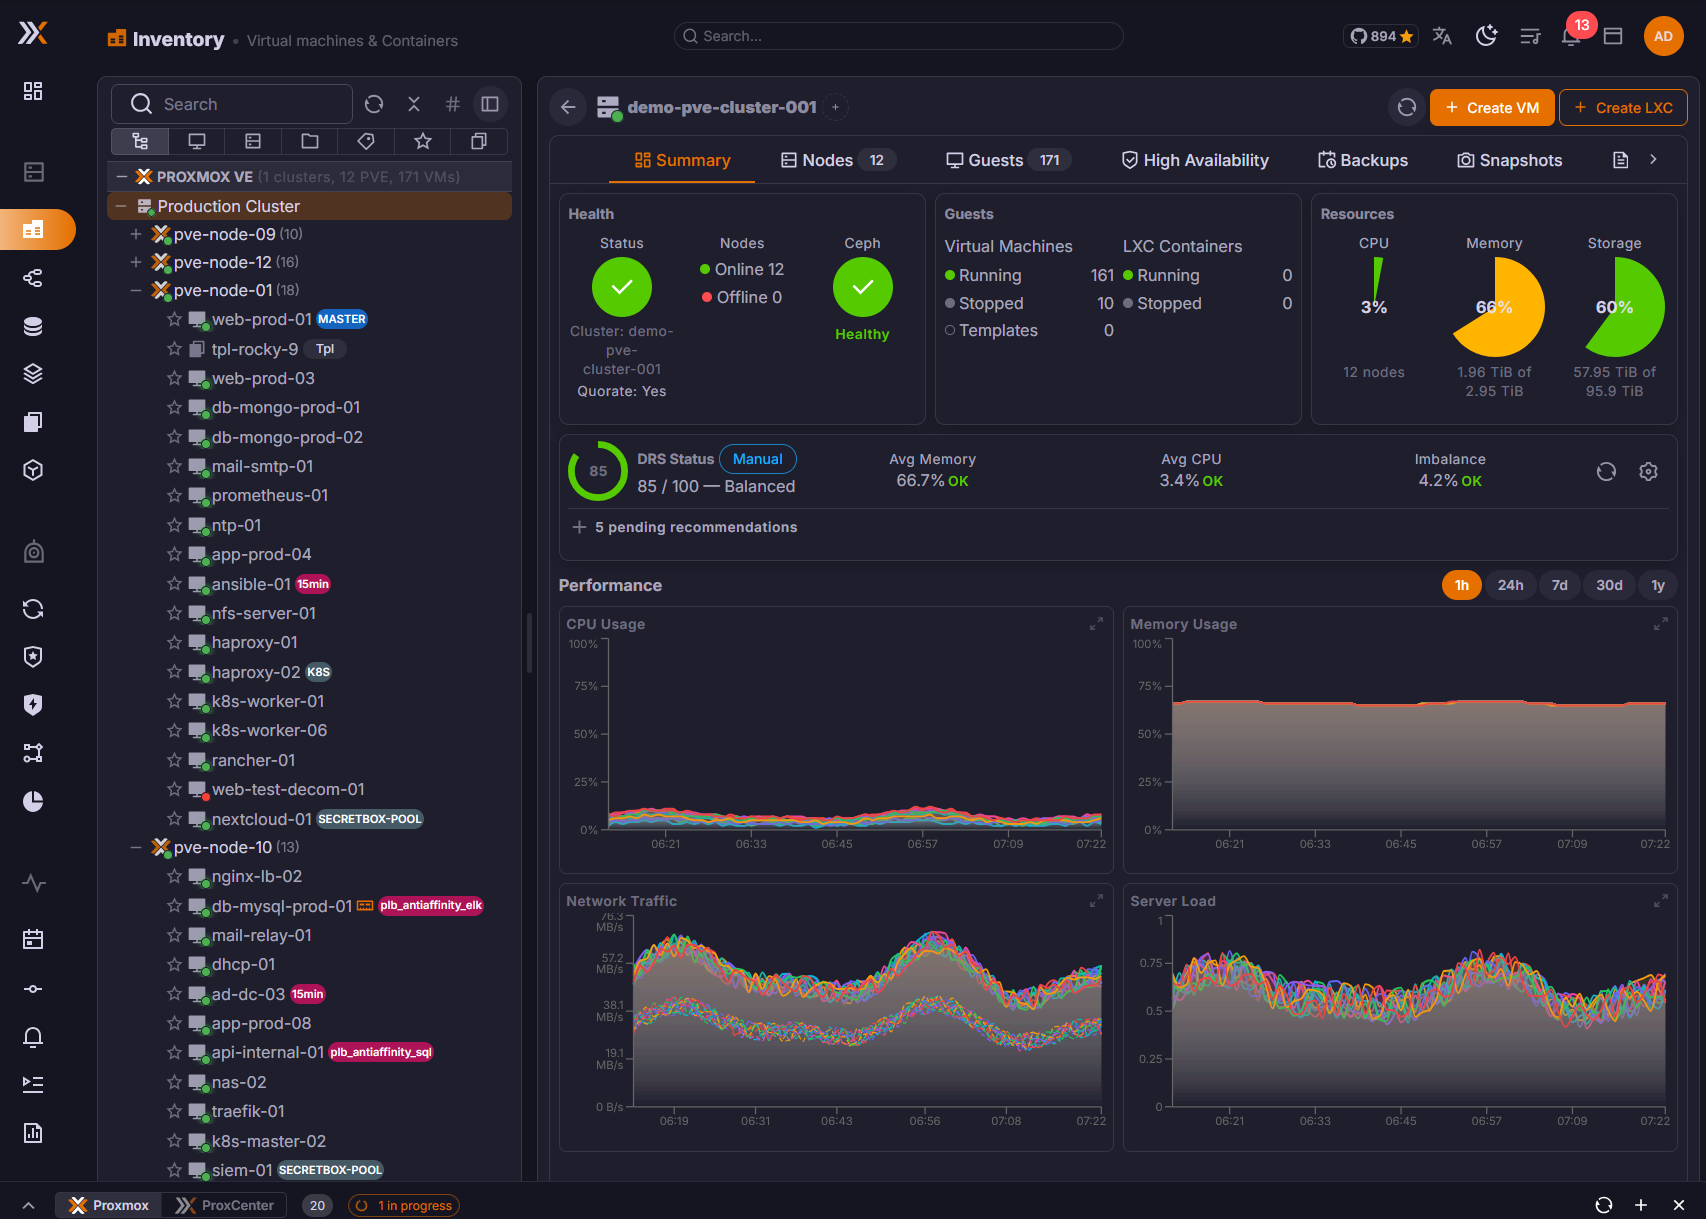
The Inventory page is the central hub for exploring your entire Proxmox infrastructure. It provides a vSphere-like tree view that organizes all your nodes, virtual machines, containers, and resources in a familiar hierarchical layout.
Split-Pane Layout
The Inventory uses a split-pane interface divided into two panels:
- Navigation tree (left) -- A hierarchical tree listing your clusters, nodes, VMs, and containers. Click any item to select it.
- Details panel (right) -- Displays detailed information about the currently selected resource.
A resizable divider separates the two panels. Drag it to adjust the proportions according to your preference.
View Modes
The navigation tree supports multiple view modes, letting you organize resources in the way that makes the most sense for your workflow.
Tree View
The default hierarchical view that mirrors your Proxmox topology:
Cluster
├── node-01
│   ├── vm-100 (web-server)
│   ├── vm-101 (database)
│   └── ct-200 (dns)
├── node-02
│   ├── vm-102 (app-server)
│   └── ct-201 (proxy)
└── node-03
    └── vm-103 (monitoring)
Hosts View
Groups all resources by Proxmox node. Useful when you need to see what is running on a specific hypervisor.
Pools View
Groups resources by Proxmox resource pool. Ideal for environments where VMs and containers are organized by project, team, or customer.
Proxmox VE 8.1 and later allow nested pools, whose id carries a /. Those are rendered as an indented, collapsible tree rather than as a flat list of slash-separated names, the way the Proxmox interface shows them, and an Expand all / Collapse all button covers every level at once. A parent that holds no guest of its own is still drawn, synthesized from the path, and its counters aggregate its descendants.
Guests belonging to no pool are not listed in this view, which again matches the Proxmox pool view: the question this view answers is which pool a guest is in.
In multi-tenant deployments, IaaS tenant resources are represented through tenant-owned vDC pools, so those tenant users only see resources in their assigned pools, while MSP tenants see the pools of the clusters they own. Provider administrators always see the full pool hierarchy.
Tags View
Groups resources by tag. If you use Proxmox tags to classify workloads (e.g., production, staging, database), this view lets you filter by those labels instantly.
Node Details
Selecting a Proxmox node in the tree opens its own set of tabs in the right panel. The Summary tab leads with the host figures, the Disks tab covers the physical hardware underneath.
Node temperatures
Proxmox exposes no temperature of its own, and a stock node has neither lm-sensors nor ipmitool installed. ProxCenter therefore reads the values straight from the kernel, over SSH, out of the hwmon tree that the drivers already publish under /sys/class/hwmon. Nothing is installed on the node.
Each reading is placed next to the figure it explains rather than in a sensors panel of its own, in the first column of the node summary:
| Figure | Temperature shown next to it |
|---|---|
| CPU usage | The hottest CPU package or core |
| RAM usage | The hottest memory module, on hardware whose DIMMs report one |
| Root FS usage | The hottest drive, NVMe included |
ProxCenter recognises the chips by name and files each one under a role, so a reading is never attributed by guesswork: coretemp, k10temp, zenpower and cpu_thermal are CPU, nvme and drivetemp are drives, spd5118 and jc42 are memory modules. Several sensors under the same role are reduced to the highest of them. A chip ProxCenter does not recognise is read but not displayed, rather than being filed under a role it may not belong to.
The value turns amber, then red, on a threshold that belongs to its role, because 55 °C is unremarkable on a CPU and alarming on an SSD:
| Role | Warning | Critical |
|---|---|---|
| CPU | 80 °C | 90 °C |
| Memory | 75 °C | 85 °C |
| Drive | 50 °C | 60 °C |
Readings outside the plausible range are dropped rather than displayed, and the whole set is cached for a minute per node, so opening a node repeatedly does not mean an SSH session each time.
Temperatures are the one part of the node view that does not come from the Proxmox API. Enable SSH on the connection first, under Settings > Connections, edit the connection, then the SSH Access section: Enable SSH access, a SSH Port, a User, and an Authentication method, either an SSH private key or a password. See Connections.
Without it, or on a node whose kernel publishes no usable sensor, there is simply no temperature next to the figures. The rest of the summary is unaffected, and nothing reports an error: the request answers "not available" rather than failing.
The root filesystem bar is labelled Root FS usage on purpose. It is the usage of / on the host, the space Proxmox itself runs on, and it says nothing about your datastores. Storage capacity lives in the Storage views.
Disk health and SMART
The Disks tab lists the physical devices of the node under Physical Disks, with their model, serial, size, type, usage and health, plus a wear indicator for the devices that report one. A device that reports no wear figure shows N/A rather than an empty or full bar.
The health column is a chip that follows what the drive actually said:
| Reported health | Chip |
|---|---|
OK, PASSED | Green |
FAILED | Red |
Anything else, UNKNOWN! included | Amber |
Amber for the unrecognised case is deliberate. A drive answering something ProxCenter does not know how to read is not a drive in good health, it is a drive whose health is unknown, and painting it green was hiding exactly the devices worth looking at.
Click a disk row to expand its SMART data. Two shapes are handled:
- Attribute tables, the classic SATA and SAS form: one row per attribute with its ID, name, current value, worst value, threshold and raw value. An attribute whose value has fallen to or below its threshold is flagged.
- The NVMe text form, which is what real hardware returns through Proxmox. It is parsed into labelled rows instead of being dumped as a block of text, and any line that does not parse is still shown verbatim underneath, so nothing the drive reported is lost.
On the NVMe form, each figure carries the direction it should be read in, which is what makes the colors mean anything:
| Attribute | Direction | A high value means |
|---|---|---|
| Available Spare | Higher is better | Plenty of spare blocks left |
| Percentage Used | Higher is worse | Endurance consumed |
| Everything else | Not classified | Shown neutral, never color-coded as health |
Available Spare Threshold is shown as the reference figure it is, without a bar of its own: it is the level at which the drive considers its spare pool exhausted, not a measurement of the drive's state.
A drive that returns nothing usable says so: SMART data is not available for this disk.
ZFS pools
The ZFS sub-tab of the same Disks tab lists the ZFS pools of the node under ZFS Pools, with size, allocated and free space, fragmentation, dedup ratio, health, state and last scrub. The health chip follows the pool: ONLINE green, DEGRADED amber, FAULTED red.
Last scrub carries the pool's own scrub sentence, in red when it reported errors, and reads Never scrubbed for a pool that has never been scrubbed at all, which on a pool holding production guests is a finding in itself.
Expand a pool row to get its vdev tree: each vdev and each device under it, indented as ZFS nests them, with its state and its read, write and checksum error counters. That is where a pool reporting DEGRADED tells you which device to replace.
The LVM, LVM-Thin and Directory sub-tabs sit alongside and cover the other storage layers of the node.
The Disks tab and everything in it is reserved for a super_admin. Reading disks and pools goes through node.view on the connection, but the tab itself is not offered to a scoped operator.
VM and Container Details
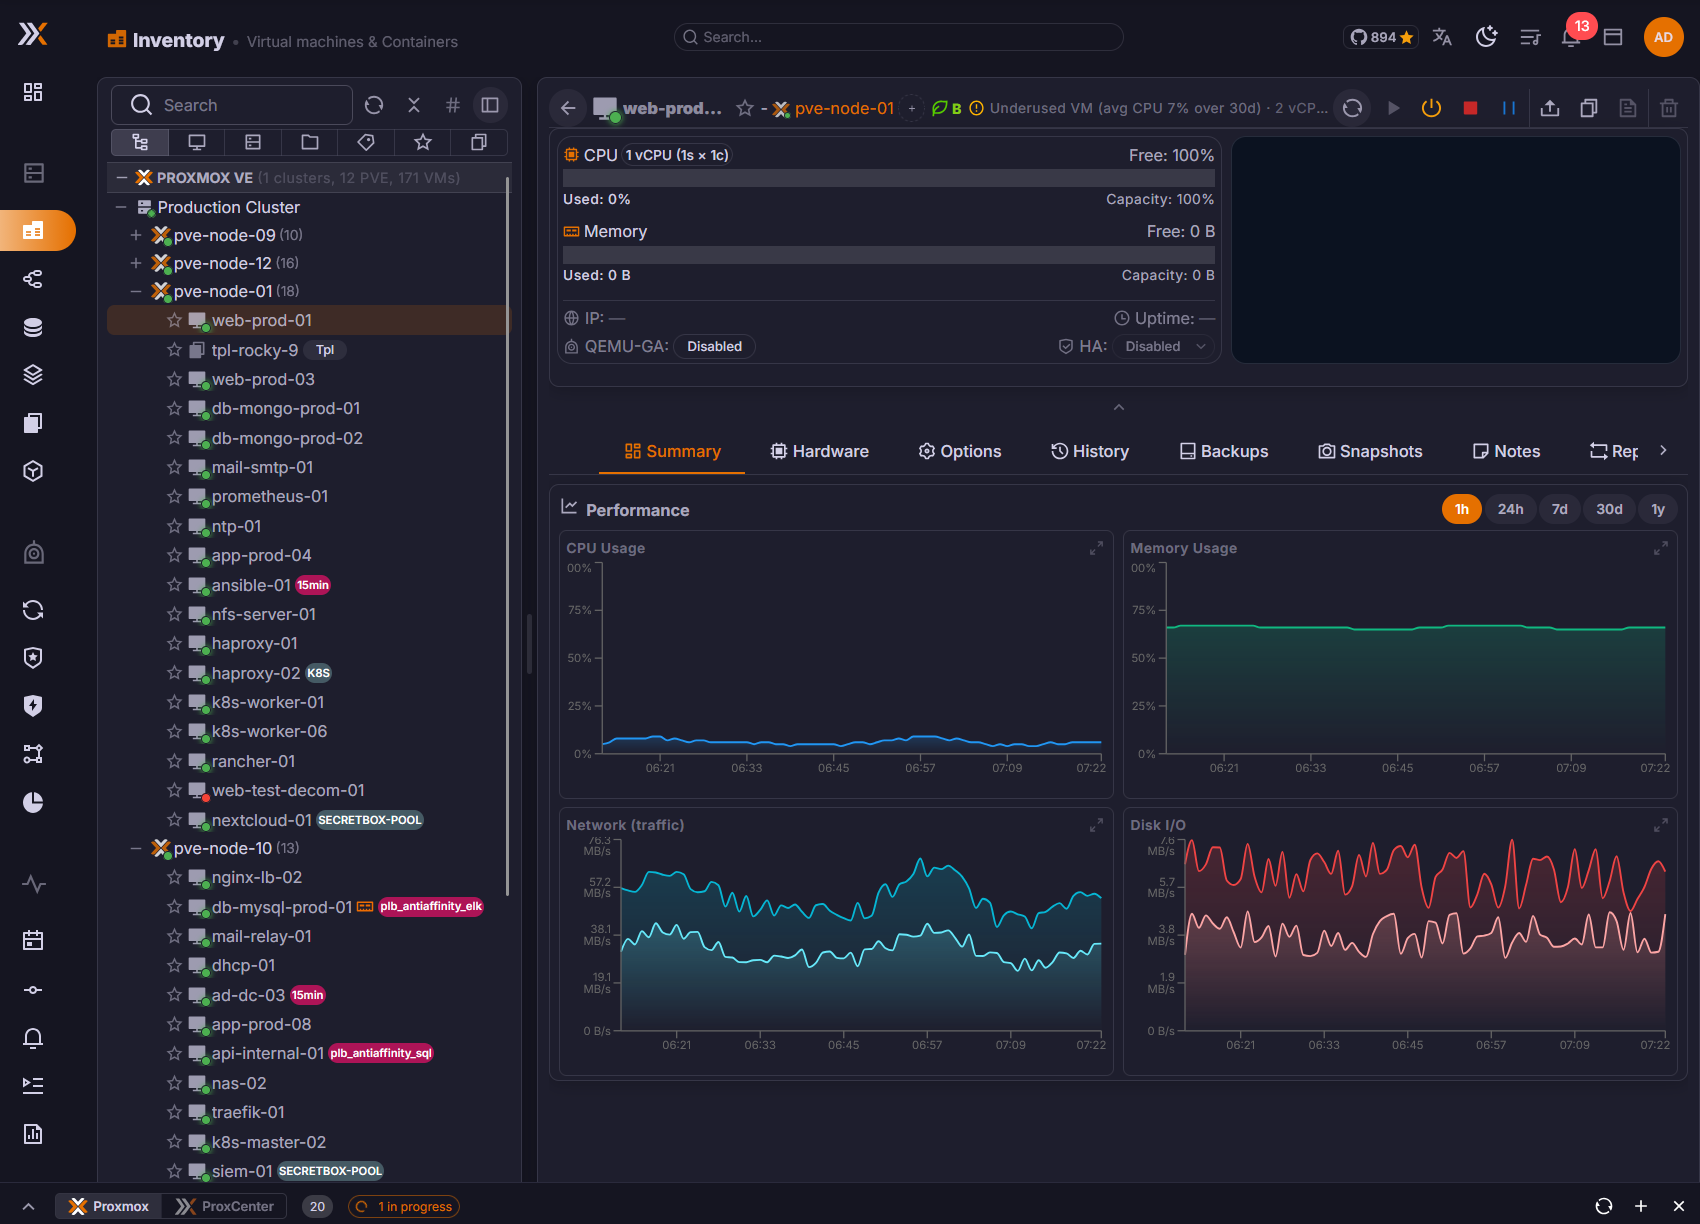
Selecting a VM or container in the tree opens a detailed view in the right panel with the following information:
| Section | Details |
|---|---|
| Status | Running, stopped, paused, or suspended state with a color-coded indicator |
| CPU | Current CPU usage, allocated vCPUs, CPU type |
| Memory | Current memory usage, allocated memory, balloon status |
| Disk | Disk size, actual usage, storage backend |
| Network | Network interfaces, MAC addresses, VLAN tags |
| IP Addresses | IPv4 and IPv6 addresses detected via the QEMU guest agent or LXC network config |
| Operating System | OS type and version as reported by the guest agent |
| Uptime | How long the guest has been running since its last start |
| Snapshots | List of available snapshots with name, date, and description |
| Green Score | 30-day energy, cost, and CO2 estimate for the VM when Green IT data is configured |
IP address detection requires the QEMU Guest Agent to be installed and running inside virtual machines. Containers report IP addresses natively.
Hardware
The Hardware tab of a guest lists its disks, each with its storage and its format on the secondary line, and its CPU and memory cards above them.
Disk format
The format shown is the one the volume really has. Proxmox removes the optional format= property from the guest configuration as soon as it has allocated the volume, so reading the configuration alone told us nothing and every disk fell back to raw, which mislabelled every qcow2 and every imported vmdk. ProxCenter now derives the format from the volume name, which is where Proxmox keeps it.
A volume with no extension, on LVM, RBD or a ZFS zvol, is still reported as raw, because that is genuinely what it is.
The formats a storage will accept are read from the cluster storage configuration rather than deduced from the storage type. Since Proxmox VE 9 the type is no longer the answer: an LVM storage with volume-chain snapshots enabled takes qcow2 too. The Add disk, Edit disk, Clone and Create VM dialogs all offer what the storage actually accepts, and the edit dialog defaults to Keep the current format rather than silently converting anything.
The Cloud-Init drive
A Cloud-Init drive is declared in the guest configuration as a CD-ROM entry, but unlike an ISO mount it is backed by a real volume that Proxmox generates and owns. It used to appear in the list as an ordinary CD-ROM, which was misleading on a block storage and, worse, offered the ISO editor on it: changing the "mounted image" would have detached the volume.
It now carries its own Cloud-Init chip and its own icon, in the disk list and in the boot order, and the row is informative only: no edit action, no disk action menu.
Changing CPU or memory
Set the new value in the CPU or Memory (RAM) card and click Save memory changes, or its CPU equivalent.
Removing memory from a running guest is slow by construction: Proxmox unplugs one DIMM at a time and pauses 3 seconds per module, so taking a running guest from 8G to 4G costs around 24 seconds at best. That used to outlive the request and reported a failed save, while Proxmox went on applying the change perfectly well.
Guest configuration writes now follow the Proxmox task instead of waiting on a single request. If the task takes longer than the budget, ProxCenter says Proxmox is still applying the change, please wait. and keeps following it, rather than declaring a failure that did not happen. A slow write also no longer counts against the health of the connection: a node that is busy is not a node that is unreachable.
The confirmation then reports what Proxmox itself says is pending, rather than guessing from the power state:
| What Proxmox reports | What you see |
|---|---|
| The change is live | Changes have been applied successfully. |
| The change is pending | The VM is running. RAM changes take effect once the VM has been stopped and started again. The Reboot action does that, a reboot issued from inside the guest does not. |
That distinction matters: a hotplugged change now reads as applied instead of always claiming a restart is needed, and a change that really is pending names the operation that will apply it. A reboot ordered from inside the guest does not, because the QEMU process is never recreated.
USB and PCI Passthrough
Proxmox only accepts a USB or PCI device given by its raw hardware address from root@pam logged in with a password. ProxCenter connects with an API token, which never satisfies that check, so the raw form failed with only root can set 'usbN' config for real devices.
Devices are therefore attached through datacenter resource mappings. The Add and Edit hardware dialogs offer Mapped device (resource mapping) and a Resource mapping picker listing the mappings this connection can use. A mapping that does not cover the guest's node is shown as such.
The raw option stays visible but disabled, with the reason on it, and a device already attached raw opens read-only rather than disappearing. The Hardware tab labels a mapped device with its mapping name.
To make a device available:
- In Proxmox, under Datacenter > Resource Mappings, create a mapping for the USB or PCI device.
- Grant the user behind the ProxCenter API token the
Mapping.Useprivilege on it, which is what the built-inPVEMappingUserrole carries.
Until that is done the picker says so rather than showing an empty list.
Container Features and Options
The Options tab is now gated by guest type: the rows that only make sense on a virtual machine, boot order, USB tablet, hotplug, ACPI, KVM, guest agent, SPICE and AMD SEV, are hidden on a container, and a container's OS type is read-only.
A container gains two rows of its own: its privilege level, read-only, and a Features editor covering Nesting, keyctl, FUSE, Create device nodes, NFS and SMB/CIFS.
Proxmox reserves container features to the root@pam account itself, and an API token never counts as root@pam. From ProxCenter only nesting can be toggled, and only on an unprivileged container. The other features are shown with their state but locked, and the tooltip says to change them, or any feature of a privileged container, in the Proxmox web interface.
Renaming a container writes its hostname, which is the key Proxmox accepts for a container; it used to write the virtual machine name key and be refused.
LXC Network Editing
For containers, the network edit dialog supports IPv4, gateway, IPv6, and interface fields. This allows operators to update LXC network configuration without leaving ProxCenter.
In tenant vDCs, network edits are validated against the tenant's allowed bridges, VNets, subnets, and IPAM reservations.
Search and Filtering
A search bar at the top of the navigation tree lets you quickly find resources by name, VMID, or IP address. Results are filtered in real time as you type.
The Command Palette
The command palette, opened with Ctrl+K, searches across the whole product: "Search pages, VMs, nodes, IPs, MAC addresses...". Results are grouped as Pages, Virtual Machines, PVE Nodes, PBS Servers, Actions and Notes.
Beyond names and VMIDs it matches:
| What | Where it comes from | Works on a stopped guest |
|---|---|---|
| MAC address | The guest configuration itself, so no guest agent is needed. bc:24:11, bc-24-11 and bc2411 all match | Yes |
| IP address | Addresses pinned in the configuration (cloud-init, container network lines) and live addresses from the QEMU guest agent or the container's own interfaces | Yes, for a pinned address. A live address is kept as the last known one and flagged stale |
| Notes | The guest's description field, with the matching excerpt shown on the row | Yes |
| Node IP | The node's own network configuration. Proxmox exposes no host NIC MAC, so nodes are found by address only | n/a |
Names keep fuzzy matching; addresses and notes are matched as substrings, because half a MAC address or half a subnet is a meaningful query while an approximation of one is not.
Live addresses come from a per-connection index refreshed in the background at most every five minutes while the guest list is in use, never from a probe per keystroke, so a large fleet costs nothing to search.
You can also apply filters to narrow down the tree:
- By status -- Show only running, stopped, or all resources
- By type -- Show only VMs, only containers, or both
- By node -- Limit results to a specific Proxmox node
Favorites
Mark frequently accessed VMs, containers, or nodes as favorites for quick access. Favorited resources appear in a dedicated section at the top of the navigation tree, so you can reach them without scrolling through the full hierarchy.
To add a favorite, right-click a resource and select Add to Favorites, or click the star icon next to its name.
The Node Shell
A node's Shell tab opens a terminal on that node. Its status bar carries two controls:
- Fullscreen, which gives the terminal the whole window and back.
- Open in a new window, which detaches the shell into a window of its own, so it can sit beside the interface rather than inside it. The tab's landing screen opens one directly, so a shell on a node is one click away.
Detached windows are named per node: clicking again on a node whose shell is already open raises that window instead of opening a second one. Each window holds its own single-use session rather than taking over the tab's, so a shell in the tab and a shell in a window can run side by side.
Attaching a Proxmox Backup Server Datastore
A cluster's Storage tab can attach a PBS datastore as a Proxmox storage directly, so a backup target no longer has to be declared in the Proxmox web interface first. The Add a storage dialog takes the cluster, a Backup server already declared in the connections, the Datastore, an optional Namespace, the Storage name the storage will carry on the cluster, and the Nodes it is available on, empty meaning every node.
ProxCenter creates a token limited to that datastore, so the cluster never holds the administrator token of the backup server. Detaching removes the storage from the cluster and revokes that token, unless another cluster still runs its backups through it. The backups already on the datastore are kept and stay visible from the backup server.
Both actions need connection management on the target cluster and backup read on the backup server, and are refused to a tenant that only sees a slice of the cluster.
Migration Detection
ProxCenter monitors your Proxmox cluster in real time and automatically detects ongoing VM migrations. When a migration is in progress:
- The migrating VM displays an animated indicator in the tree
- The details panel shows the source and destination nodes
- The migration progress is updated in real time until completion
Migration detection works for both online and offline migrations initiated from ProxCenter or directly from the Proxmox API.
Green Score
When datacenter factors are configured, the VM header displays a Green Score summarizing the last 30 days of estimated energy, cost, and CO2 impact. Hover the score to view the calculation context:
- CPU average
- Datacenter PUE
- Energy, cost, and CO2 deltas
- One actionable insight, such as idle CPU, oversized RAM, mostly stopped workload, or efficient datacenter placement
See Datacenters & Green IT for datacenter configuration.
Permissions
Access to the Inventory page requires the following RBAC permissions:
| Permission | Description |
|---|---|
vm.view | View virtual machines and containers, their status, and details |
node.view | View Proxmox node information and resource usage |
Users without these permissions will not see the Inventory entry in the sidebar.